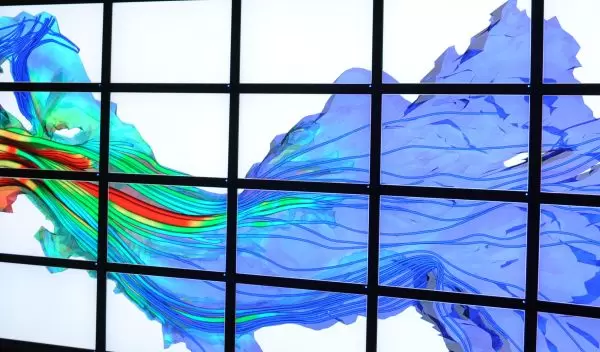
A New Vision for Scientific Visualizations
From Isaac Newton's orbiting cannonball to Albert Einstein's famous journey beside a beam of light, the history of science is full of famous visualizations that helped lead to new breakthroughs in how we understand complex concepts and phenomena.
In recent decades, researchers have used computers to build complex visualizations based on large data sets to gain a better perspective on their research. When a computer combines a map with the data from thousands of sensors measuring ocean currents and temperatures around the globe, for example, a collection of numbers can become a stunning visualization that helps us understand shifting climate patterns. Likewise, a computer-generated visualization can help a surgeon better understand what is happening inside a patient's heart before ever picking up a scalpel.
Programming a computer to produce these visualizations is not an easy task, however. And as the amount of data collected in our world grows, the challenge of organizing all that information into an accurate and cohesive picture becomes even more difficult.
Enter VisTrails, a National Science Foundation- (NSF) supported suite of visualization tools developed by Juliana Freire and Claudio Silva, both associate professors of computer science at the University of Utah. VisTrails makes it much easier for scientists to create complex visualizations, data mining and other types of large-scale data analysis applications by automating many of the difficult and time-consuming backend work that goes into producing them.
VisTrails automatically manages the data, metadata and data exploration process necessary to create visualizations, a chore that is typically quite tedious and time-consuming when trying to organize the vast volumes of data. The result is a tool that lets researchers focus on the data sets and visualizations themselves, rather than the work needed to bring them together.
VisTrails also offers a cost-effective way of creating large display arrays for presenting the visualizations it creates. To get an idea of how it works, imagine walking into an electronics store and gathering up several computers, and then grabbing 24 large flat-screen video monitors. Using VisTrails, you could actually get these computers and monitors to work together to produce a single high-resolution visualization of the brain's vascular system or dynamics of an erupting volcano.
The technology is already being used by universities, laboratories and even private companies around the world, and the Utah team plans future upgrades to make the system even more robust and easier to use.
