GRANTED awards & proposal submission data
Awards by GRANTED funding opportunity
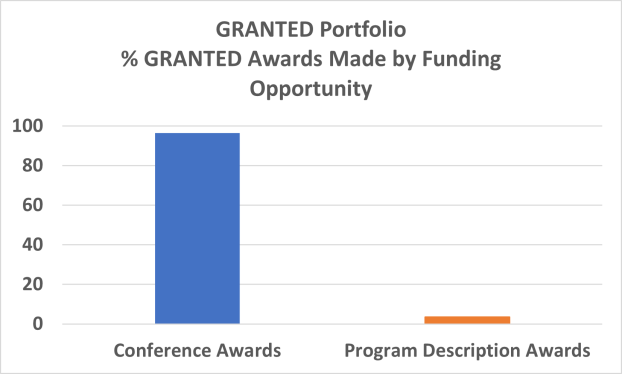
The bar graph below shows the percentage of award investments made from the NSF GRANTED program in FY 2023. 97% of GRANTED awards support conference awards and 3% support program description funding opportunity. awards.
Credit: National Science Foundation
Proposals by GRANTED funding opportunity
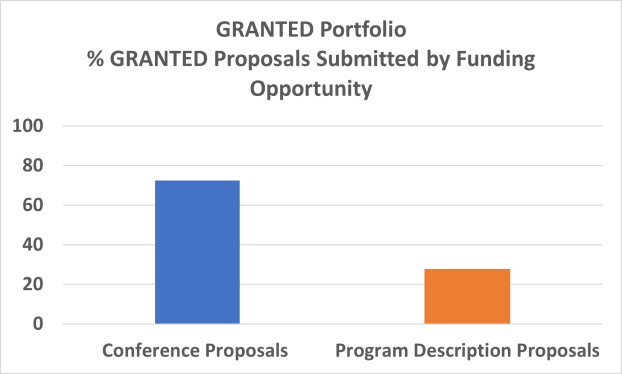
The bar graph below shows the percentage of proposals evaluated by the NSF GRANTED program in FY 2023. 73% were conference proposals and 23% were proposals submitted to the GRANTED program description funding opportunity.
Credit: National Science Foundation
Awards by GRANTED sectors
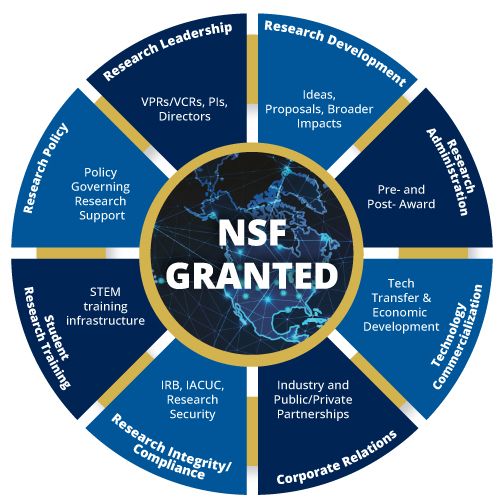
The NSF GRANTED Wheel illustrates the research support and service infrastructure sectors supported by GRANTED awards.
In Fiscal Year 2023:
- 38% of GRANTED awards focus on growing access to Research Administration support
- 38% of GRANTED awards focus on growing access to Research Development support
- 13% of GRANTED awards focus on growing access to Research Leadership support
- 8% of GRANTED awards focus on growing Broader Impacts support
- 4% of GRANTED awards focus on growing access to Research Training Management
support
Awards by Principal Investigator
Awards by PI status
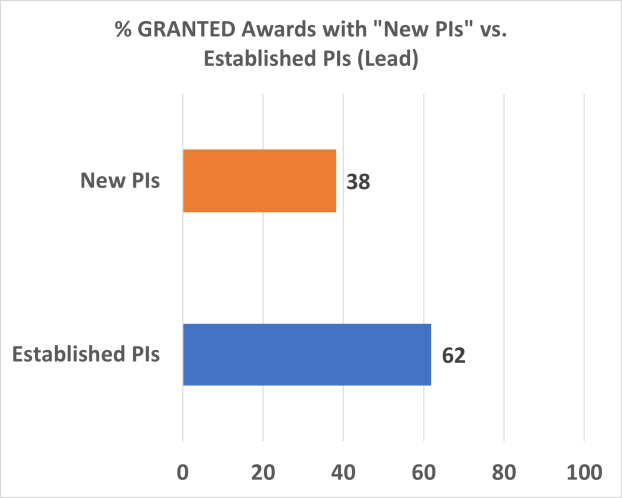
The bar graph below shows the percentage of GRANTED award investments by lead principal investigator (PI) status. 38% of GRANTED awards are led by new PIs (PIs who have had no prior NSF support).
Credit: National Science Foundation
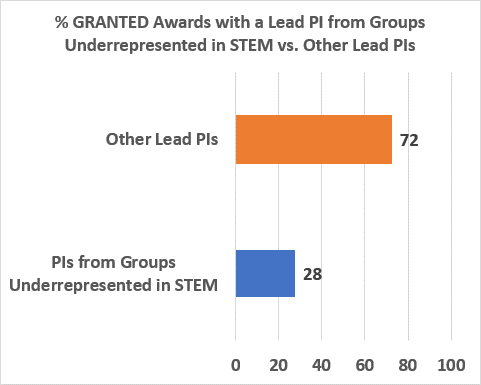
Awards made to lead PIs underrepresented in STEM
The bar graph below shows the percentage of GRANTED award investments made to lead principal investigators underrepresented in STEM (PI). 28% of GRANTED award lead PIs self-identify as belonging to a group underrepresented in STEM.
Credit: National Science Foundation
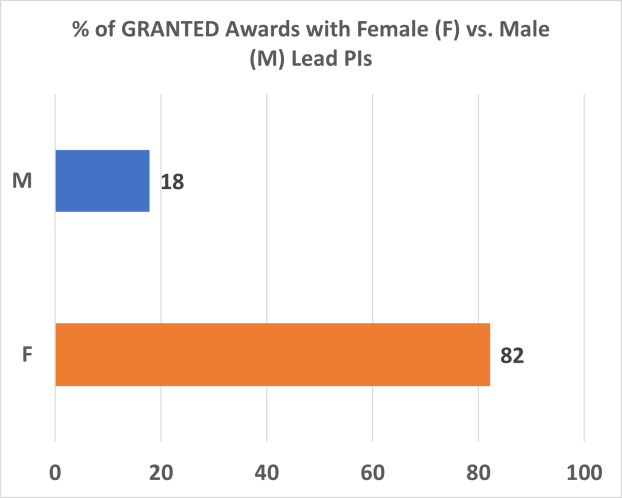
Awards by PI gender
The bar graph below shows the percentage of GRANTED award investments made by gender of lead principal investigators (PI). 82% of GRANTED awards support Female PIs
Credit: National Science Foundation
Institutional award data
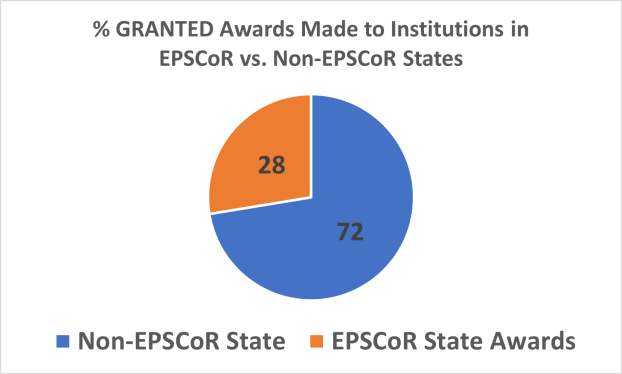
Awards made to institutions in EPSCoR jurisdictions
The pie chart below shows the percentage of GRANTED award investments made to institutions in EPSCoR jurisdictions/states. 28% of GRANTED awards support institutions in EPSCoR jurisdictions.
Credit: National Science Foundation
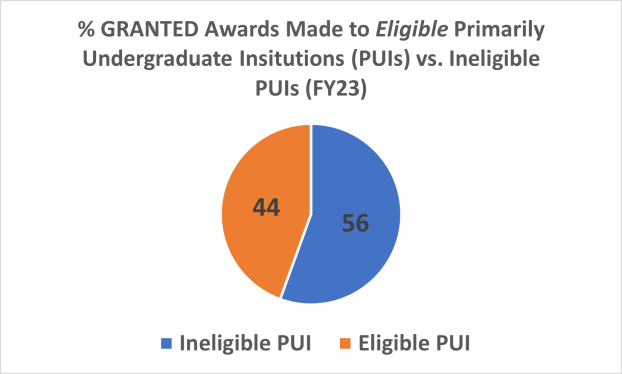
Awards made to Eligible Primarily Undergraduate Institutions
The pie chart below shows the percentage of GRANTED award investments made to Eligible Primarily Undergraduate Institutions (PUI). 44% of GRANTED awards support eligible PUIs.
Credit: National Science Foundation
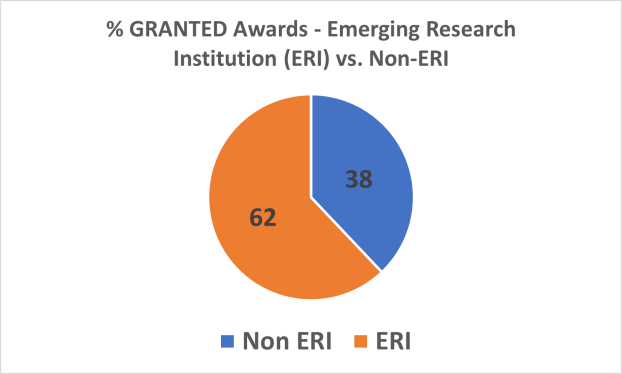
Awards made to Emerging Research Institutions (ERI)
The pie chart below shows the percentage of GRANTED award investments made to Emerging Research Institutions (ERI). 62% of GRANTED awards support ERIs.
Credit: National Science Foundation
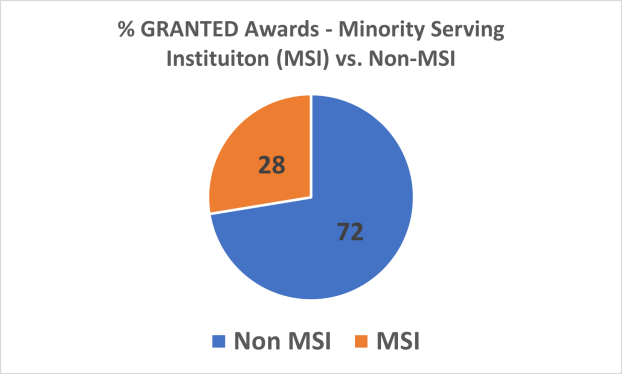
Awards made to Minority Serving Institutions (MSI)
The pie chart below shows the percentage of GRANTED award investments made to Minority Serving Institutions (MSI). 28% of GRANTED awards support MSIs.
Credit: National Science Foundation

